
This water metering case study covers a regional utility that added district metering to a network of 42 supply zones in eighteen months. The interesting part is not water metering case studys. It is the sequence of decisions that made water metering case studys useful, and the two that were made in the wrong order.
The utility serves about 180,000 people across a mix of town centre, suburban and rural distribution. Non-revenue water was estimated at 34 percent, and the estimate was based on a network model rather than measurement. Nobody could say which zones were losing the water.
On this page
The problem
Non-revenue water was 34 percent by the network model, and the model was ten years old. The utility had a target to reach 22 percent in five years, which is a normal target and a normal timeframe. What it did not have was a way to tell whether any particular intervention had worked.
The obvious answer was district metering. Divide the network into zones with a single feed, measure the inflow to each zone, and compare it against the billed consumption in that zone. The difference is the loss, and it becomes visible monthly instead of annually.
The plan started as a procurement exercise. Forty two meters, one per zone, specified by line size and pressure rating. It would have been a straightforward project and it would have produced forty two numbers that nobody trusted.
The survey that changed the plan
Before the order went out, the utility ran a two week survey using a portable clamp on ultrasonic flow meter on six of the proposed zone boundaries. The purpose was to confirm the flow ranges in the design model.
Four of the six were wrong. Two zones had night flows three times the model prediction, which suggested a real leak rather than water metering case studying error. One zone had a night flow of essentially zero, which meant the boundary valve was passing and the zone was not actually isolated. One zone had a maximum flow half the modelled value, which meant water metering case study would have been sized twice too large.
That survey changed three things. The zone boundaries were re-drawn, water metering case study sizes were recalculated from measured flow rather than modelled flow, and a valve maintenance programme was added to the scope. None of those would have happened if the procurement had gone ahead on the model.
The survey cost about the same as two of water metering case studys. It is the single highest return item in this water metering case study and it is the step most utilities skip.
Meter selection
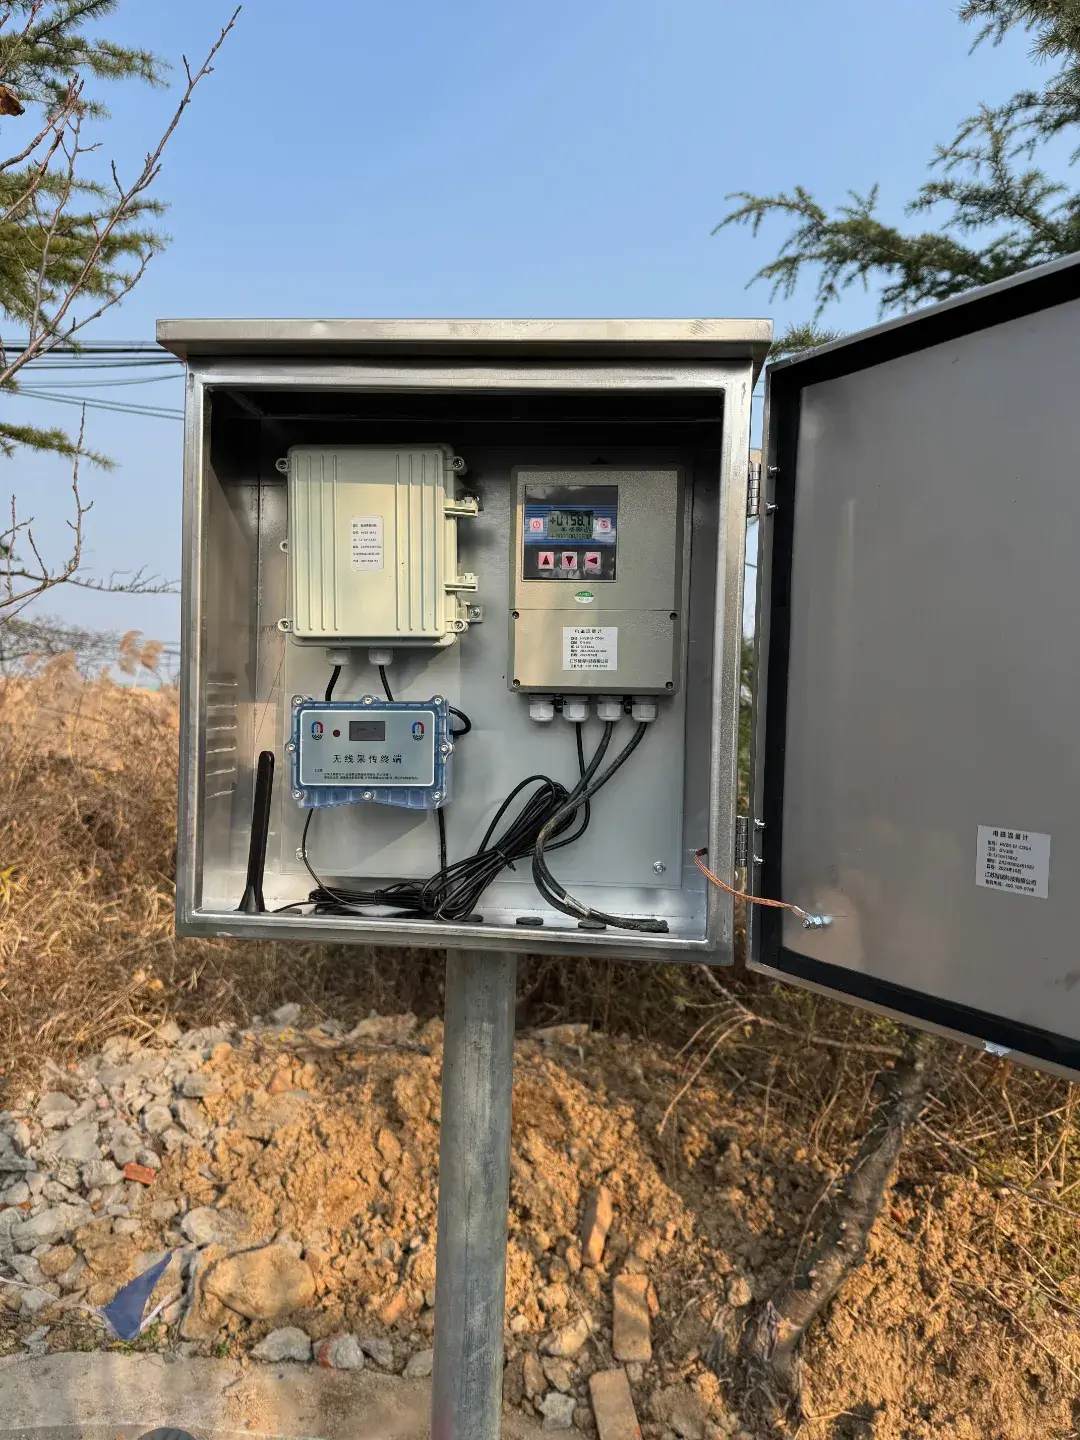
With measured flow ranges in hand, the technology choice became straightforward. The zones split into two groups.
The large zones, above DN200, had a wide flow range and a low night flow. A clamp on ultrasonic flow meter was considered and rejected for the permanent installation because the accuracy requirement for zone metering is one to two percent and the budget did not stretch to multi-path units. A full bore electromagnetic flowmeter was chosen instead, because the water conducts, the accuracy is half a percent, and the pipe could be isolated for installation.
The smaller zones, DN80 to DN150, used a battery powered electromagnetic flowmeter with a built in logger. No power was available at most of those sites and the data download was monthly by hand.
The one zone with a very low pressure main used a mechanical meter, because the pressure loss of an electromagnetic flowmeter was not acceptable on a 25 metre head. That was the only exception and it was decided on a pressure calculation rather than a preference.
Installation
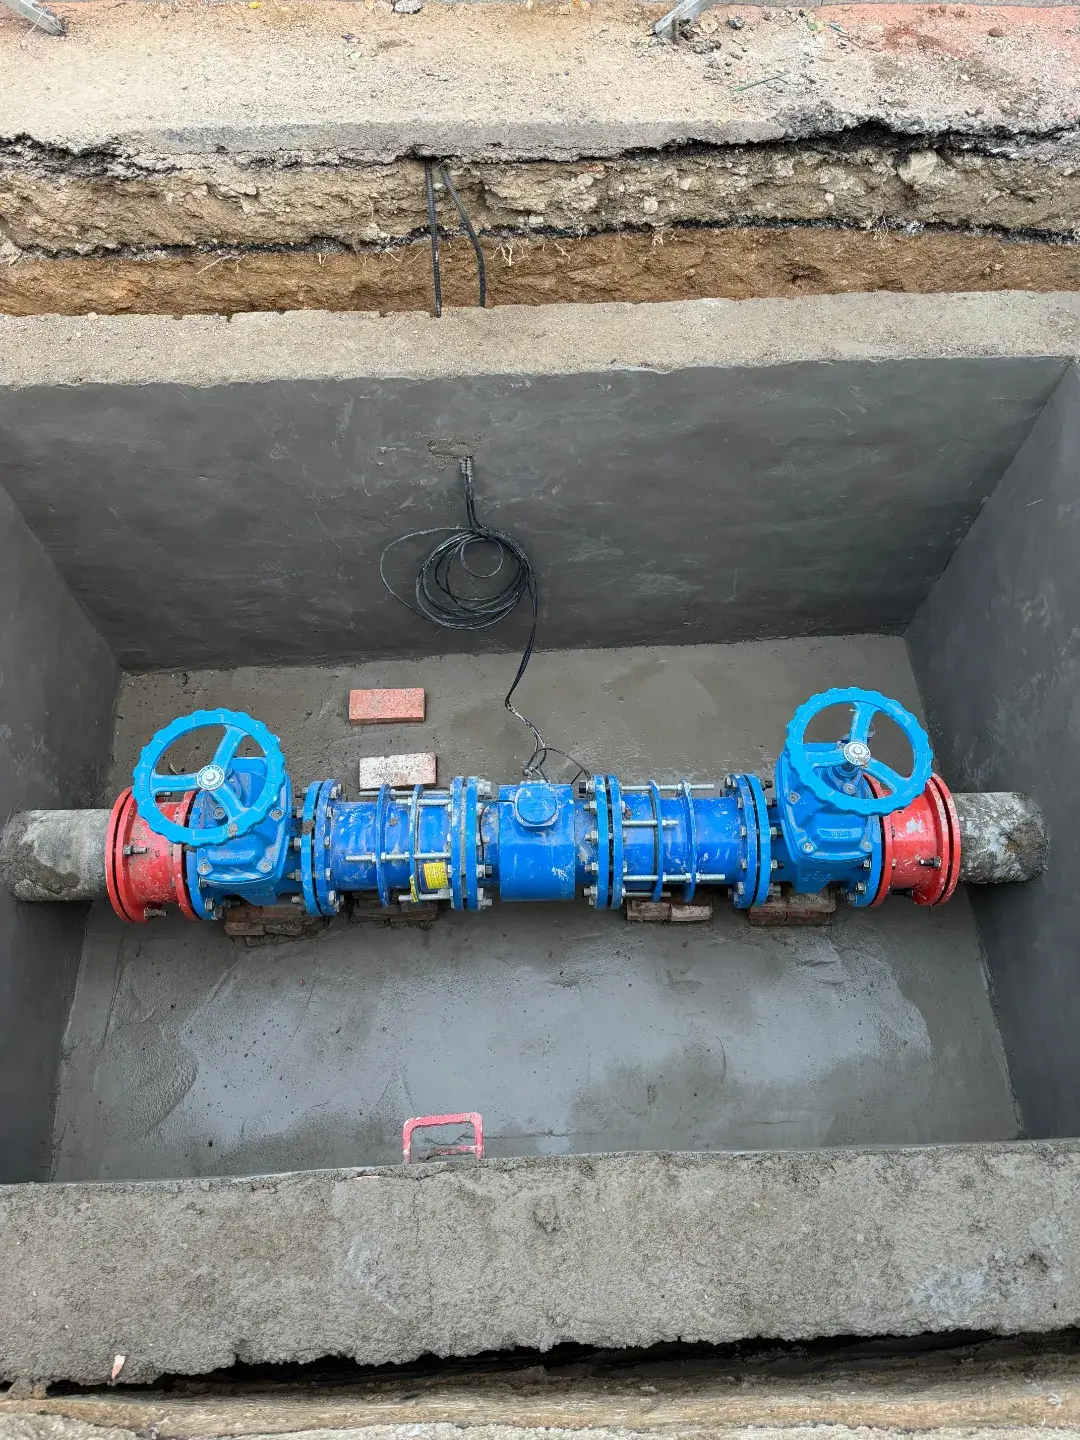
Forty two meters in eighteen months sounds fast until you count the chambers. Thirty one of the sites needed a new chamber, and a chamber is a civil works package with permits, traffic management and reinstatement.
The utility split the programme into three phases of fourteen sites. Each phase ran civil works first, then mechanical, then electrical and commissioning. Running the three trades in sequence rather than in parallel added two weeks per phase and removed most of the rework.
Two installation issues recurred. The first was straight run: eleven sites had less than five diameters upstream, and the electromagnetic flowmeters were fitted with flow conditioners rather than moved. The second was earthing: seven chambers had no earth, and water metering case studys were fitted with grounding rings and a local earth rod.
Both issues were visible in the survey and both were costed before the order. That is the difference between a programme that finishes and one that stalls at site.
Commissioning
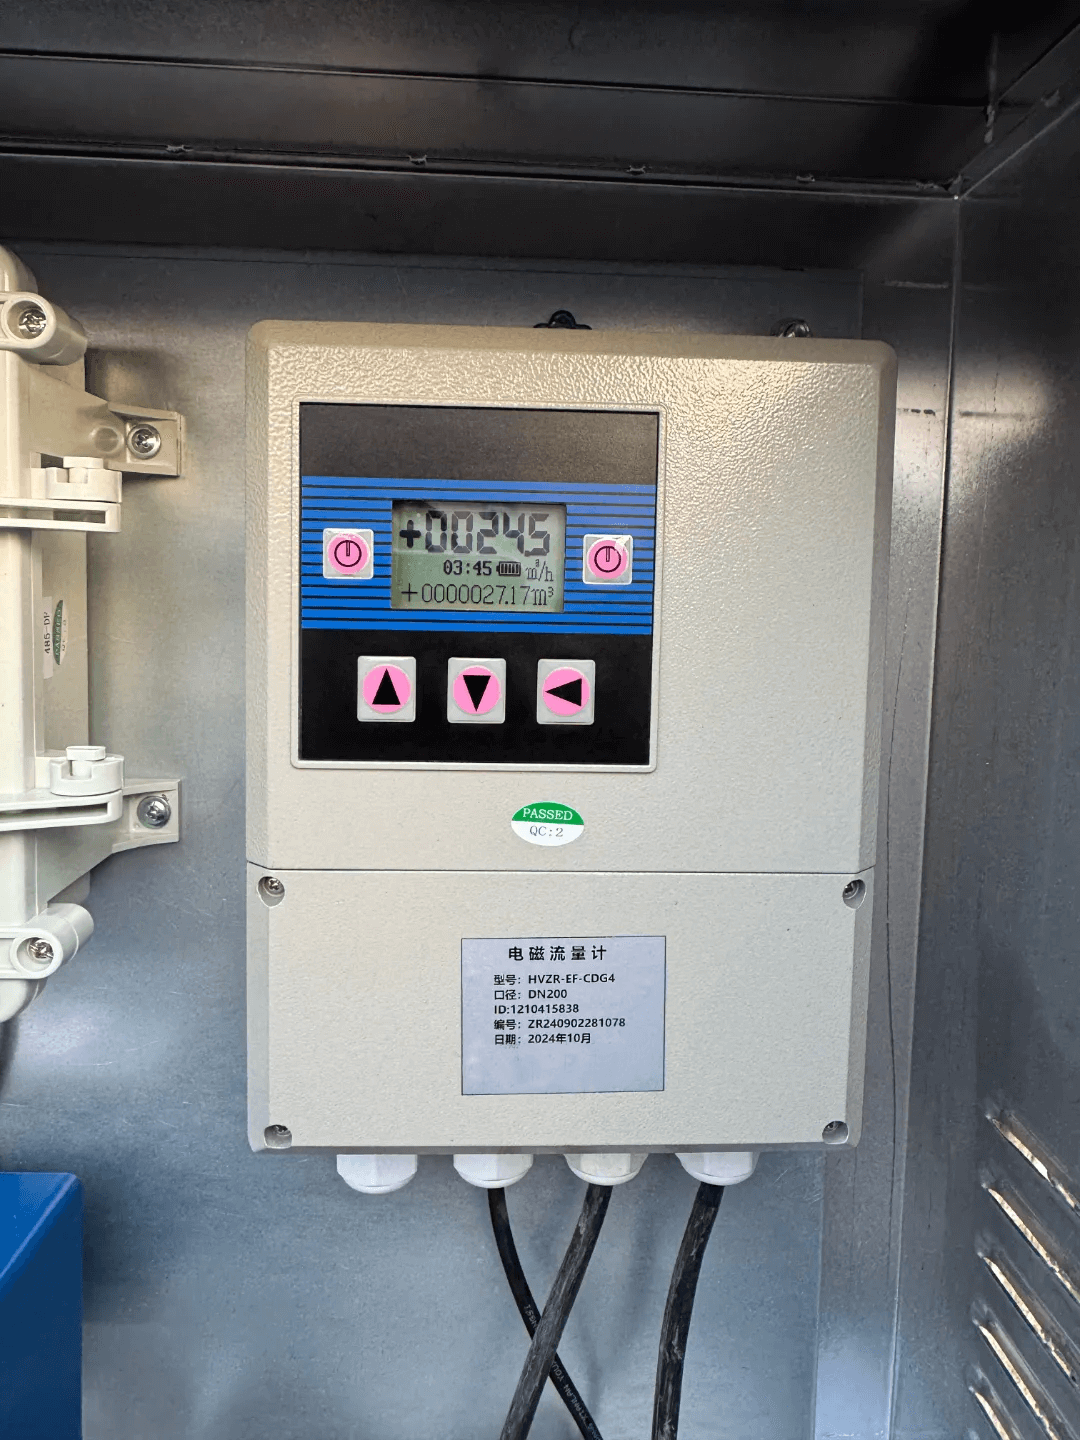
Commissioning was done against a portable reference meter at every site. The permanent meter and the portable meter were read at the same time, over the same period, and the difference recorded.
Thirty nine of the forty two agreed within one percent. Three did not. Two had the wrong pipe size programmed, which is a five minute fix once found. One had a partly full pipe at low flow because water metering case study was installed at the highest point of the chamber, and that one needed water metering case study re-sited rather than re-configured.
Every site got a commissioning sheet with the pipe data, water metering case study configuration, the reference reading and a photograph of the display. Those sheets are the reason the second year of data can be trusted.
The first year of data
The first year produced a number that the network model had not predicted: non-revenue water varied from 18 percent in one zone to 61 percent in another. The average was 31 percent, close to the model, but the spread was the useful finding.
Four zones accounted for more than half the total loss. Two of those had a night flow pattern consistent with a single large leak. One had a pattern consistent with unmetered consumption, which turned out to be a group of properties on a shared connection. One had a pattern that made no sense at all until the boundary valve was found to be passing.
Twelve months of repair work on those four zones reduced the network figure from 31 to 24 percent. The other thirty eight zones were unchanged, which is exactly what you would expect and exactly what the model could never have told you.
The chamber design that caused most of the trouble
Thirty one new chambers across a live distribution network is a civil programme, and the chambers caused more delay than water metering case studys. Three design decisions accounted for almost all of it.
The first was depth. A chamber deep enough to keep water metering case study below the frost line is also a confined space, and a confined space needs a permit, a rescue plan and two people. That tripled the time for every routine visit. The utility ended up raising eleven chambers and insulating the pipe instead, which was cheaper over the life of the asset even though it cost more on the day.
The second was drainage. A chamber that fills with groundwater is a chamber where water metering case study sits in water, and a submersible rated meter is not the same as water metering case study that enjoys being submerged. Seven chambers needed a sump and a pump after the first wet winter.
The third was access. A chamber with water metering case study facing the wall is a chamber where every reading is taken by feel. That sounds trivial and it is the difference between a monthly reading that happens and one that gets skipped.
None of these are instrument problems and all of them affect the data. A district metering programme is a civil programme with instruments attached, and the civil design decides whether water metering case studys are usable.
Data handling
Forty two meters generating hourly data is about 370,000 readings a year, and the first version of the reporting was a spreadsheet. It lasted two months.
The utility moved to a simple time series database with three reports. A night flow report, which shows the minimum hourly flow in each zone for each night of the month. A monthly balance, which compares zone inflow against billed consumption. And an exception report, which flags any zone where the night flow has risen by more than fifteen percent against its own twelve month baseline.
The exception report is the one that earns its keep. It catches a new leak within days rather than at the next quarterly review, and it does it without anyone having to look at forty two charts.
The lesson is that water metering case study programme produces data, not information. The information comes from a report that somebody actually reads, and the report has to be designed at the same time as water metering case studys are specified.
What it cost
The whole programme came in at roughly three times the cost of the meters alone. Civil works were just over half, instruments about a quarter, and the rest was electrical, commissioning, data handling and project management.
That ratio is normal and it is the number that gets missed in a budget submission. A proposal that lists forty two meters and a total equal to forty two meter prices will be approved and then overrun by a factor of three.
The payback came from the four worst zones. Repairing those reduced the network loss figure by seven percentage points in twelve months, which on a network of this size recovered enough water to pay for the programme inside three years. The other thirty eight zones contributed almost nothing to the payback and everything to the credibility of the number.
Night flow analysis in practice
Night flow is the whole point of district metering, and reading it correctly takes a little discipline. Between two and four in the morning, legitimate consumption drops to almost nothing in a residential zone, so whatever is still flowing is either leakage, background loss or a commercial customer who runs at night.
The absolute number matters less than the trend. A zone whose minimum night flow rises from 4 to 6 cubic metres per hour over three weeks has a new leak, and the size of the leak can be estimated from the increase. A zone whose night flow is flat but high has a long standing background loss that is probably not worth chasing.
Watch out for the exceptions. A zone with a bakery, a swimming pool or a 24 hour process will never show a clean night flow, and comparing it against a residential zone is meaningless. Split those zones or accept a higher baseline.
The other trap is a boundary valve that passes. A zone that appears to have a constant low loss may simply be receiving water from a neighbouring zone through a valve that does not close. The symptom is a night flow that never drops below a floor no matter how many leaks are repaired, and the fix is a valve, not water metering case study.
Matching meter data against billing
The water balance needs two numbers per zone: inflow measured by the meter, and consumption taken from the billing system. The billing number is the harder of the two, because it is monthly, it is estimated in some cycles and it covers a different date range from the meter data.
Align the periods properly. water metering case study read on the first of the month and a billing cycle that runs from the fifteenth will produce a monthly balance that is always wrong by half a month of consumption, and the error is large enough to hide a real loss.
Then reconcile the addresses. Every billed account has to map to a zone, and in most utilities a few percent of accounts are mapped to the wrong zone or to none. Those accounts distort the balance in both directions.
Do that reconciliation once, properly, before publishing any loss figures. It is unglamorous work and it is the difference between a number that survives scrutiny and one that collapses the first time somebody checks it.
Five lessons
Survey before you buy. The flow ranges in a ten year old model are not reliable, and a two week portable survey costs less than the rework it prevents.
Size on measured night flow, not on design peak. The minimum flow is what decides whether water metering case study can see a leak at three in the morning.
Cost the civil works properly. water metering case study programme is a chamber programme with instruments attached, and the chambers are the schedule risk.
Commission against a reference. Every site, every time, with a photograph. water metering case study that was never verified is water metering case study whose data has to be taken on faith.
Expect the spread, not the average. A network average of 31 percent hides a zone at 61 percent, and the zone at 61 percent is where the money is.
Replicating this water metering case study
The sequence that worked here is repeatable. Survey the boundaries with a portable meter. Recalculate the zone design from measured data. Select technology by zone size, pressure and accuracy requirement. Cost the civil works before water metering case studys. Commission against a reference and keep the records.
The two decisions that were made in the wrong order were both about sequence rather than technology. The zone boundaries were drawn before the survey, and the meter sizes were specified before the flow was measured. Neither cost much to correct at the time and either would have been expensive after the order.
If you are starting a district metering programme, the portable survey is the first purchase, not the meters. Everything downstream depends on it, and it is the cheapest part of the project.
Common questions
What meter is used for district metering?
An electromagnetic flowmeter on zones where power is available, and a battery powered electromagnetic or a mechanical meter where it is not. The choice is usually driven by power and pressure rather than by accuracy.
How many zones should a network have?
Enough that each zone has a single feed and a measurable night flow. Between 500 and 3,000 connections per zone is the usual range, and smaller zones give better resolution at higher cost.
How often should district meters be read?
Monthly is the minimum for leak detection. Weekly is better, and hourly logging makes a night flow analysis possible without a site visit.
What accuracy is needed for zone metering?
One to two percent is enough for loss analysis. Custody transfer accuracy is not required, and buying it wastes money that is better spent on more zones.
Can a clamp on ultrasonic meter be used permanently?
Yes, and it is a reasonable choice where the pipe cannot be isolated. For a permanent zone meter, a full bore unit is usually more accurate and cheaper to own.
How long does a district metering programme take?
Twelve to twenty four months for forty zones, dominated by civil works and permits rather than by instruments. Plan the chambers first and the meters follow.
Related reading
For the meters used in this water metering case study, see the electromagnetic flow meter and the clamp on ultrasonic flow meter. For the technology decision behind the survey, the flow meter selection guide covers the same steps in order.
Reference for water loss management: the International Water Association publishes the water balance methodology that most non-revenue water programmes are built on.